Incrementality
Part of CTV supply quality
Investigating Unusually High Completion Rates
A very high video completion rate may be normal for a non-skippable connected-TV format, or it may reflect how the player reports events. It is a prompt for …
A very high video completion rate may be normal for a non-skippable connected-TV format. It may also reflect how playback events are reported. Treat it as a reason to investigate, not proof of fraud or attentive viewing.
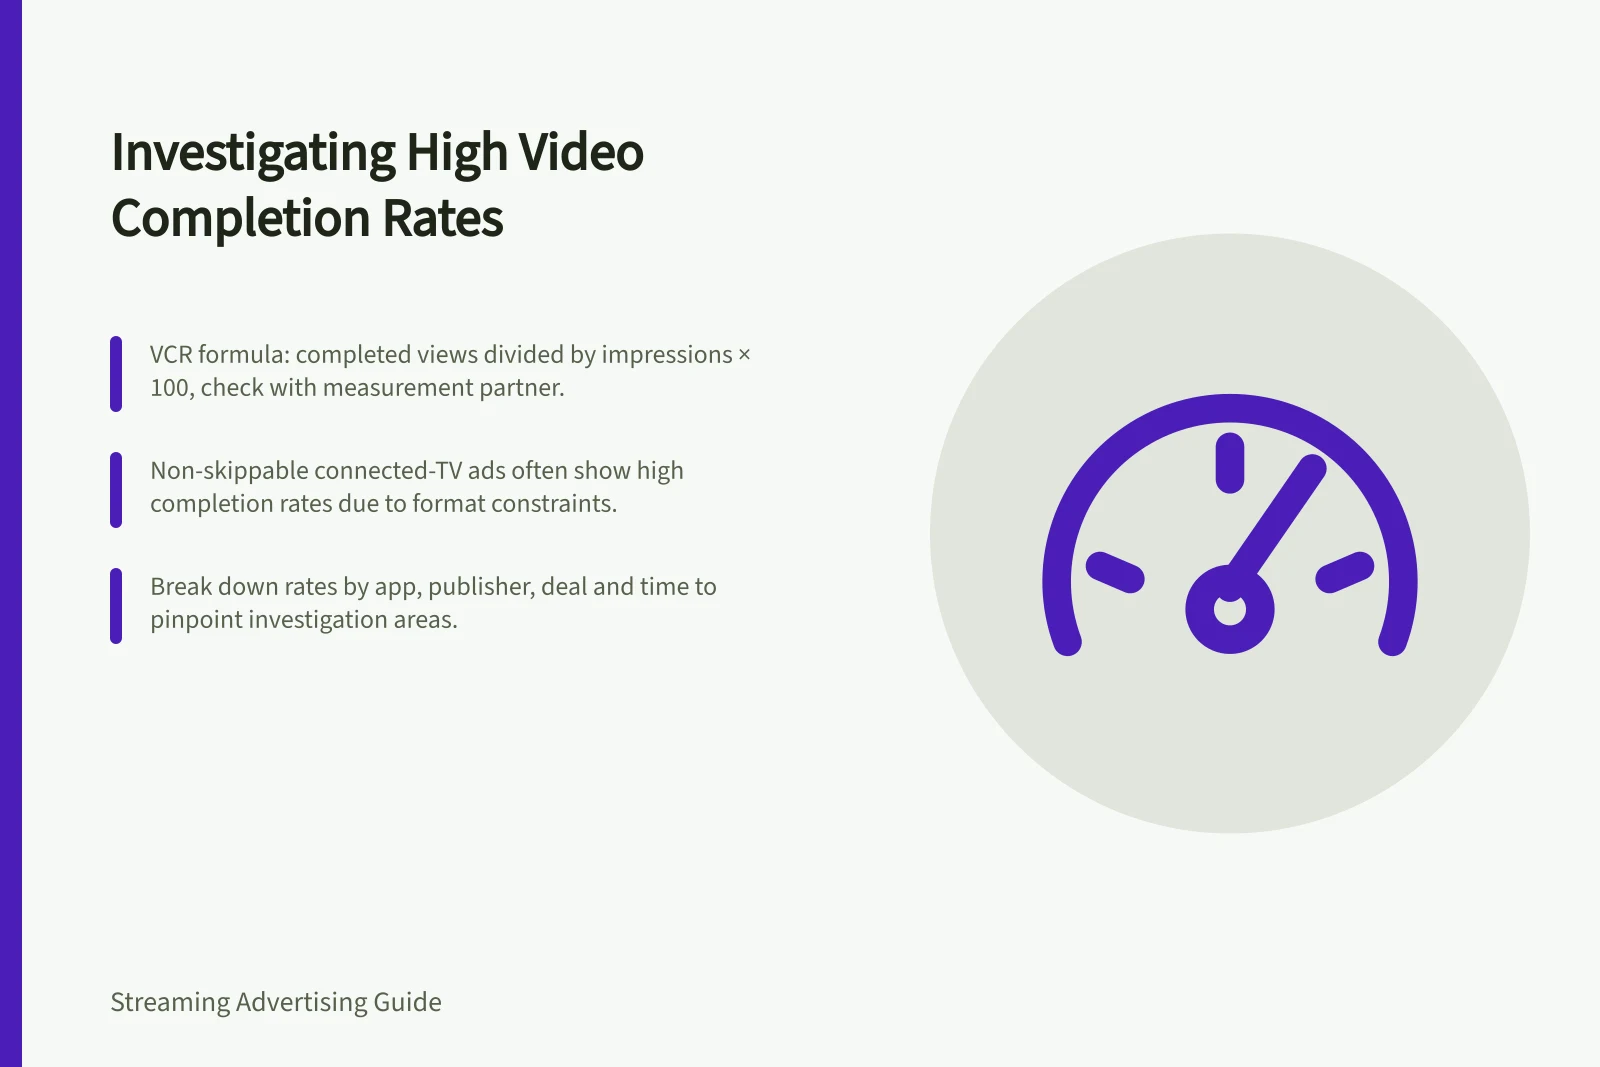
Step 1 — Define the metric. One published Video Completion Rate (VCR) formula divides completed views by video impressions and multiplies by 100. Ask the measurement partner for its formula and denominator, and confirm what event it counts as a completion; definitions can differ.
Step 2 — Make a like-for-like comparison. Compare ads of similar length and placement, using the same metric definition, and check whether each format is skippable. A high rate can be expected for a non-skippable connected-TV ad, so comparing it with a different format may not explain the result.
Step 3 — Locate where the rate changes. Break it out by app, publisher, deal and time. Use those splits to find where to investigate, not as proof of the cause.
Step 4 — Inspect the event and its processing. Request the underlying event counts and measurement method. Establish whether the player or a server sends the completion event, and whether invalid traffic is removed before the rate is calculated.
Step 5 — Check expected player behaviour. IAB Tech Lab’s Digital Video Ad Serving Template (VAST) specification describes expected behaviour when a player executes a VAST-formatted ad response.
Check the relevant VAST specification for the response. A completion report is still a playback event, not proof that a viewer watched attentively.
Step 6 — Compare available measurement signals. Ask whether the measurement partner can provide Open Measurement (OM) SDK signals for the inventory.
The IAB Tech Lab OM SDK can measure whether an ad appears on screen, the percentage in view and for how long. It also supports transparency of overlays and quartile measurement, which can use different methodologies.
Step 7 — Reconcile and record the result. Compare the completion event and counts with the denominator, processing method and signals available for that inventory.
Record the formula, completion definition, format, counts, event source, invalid-traffic treatment, relevant signals and conclusion. If these do not explain the rate, ask the measurement partner and relevant publisher or platform to investigate the mismatch.
Classify the result as explained by format, explained by measurement or data processing, or unresolved. Keep reach and business outcomes separate from completion.
Measurement Signals from Open Measurement (OM) SDK
- Ad Visibility
- On-screen presence verified
- Duration in View
- Time spent visible on screen