Incrementality
Part of CTV response paths
Measuring visits without attributing every direct session to CTV
Separate tagged QR visits, dedicated-address use and direct sessions so CTV reporting reflects what was observed.
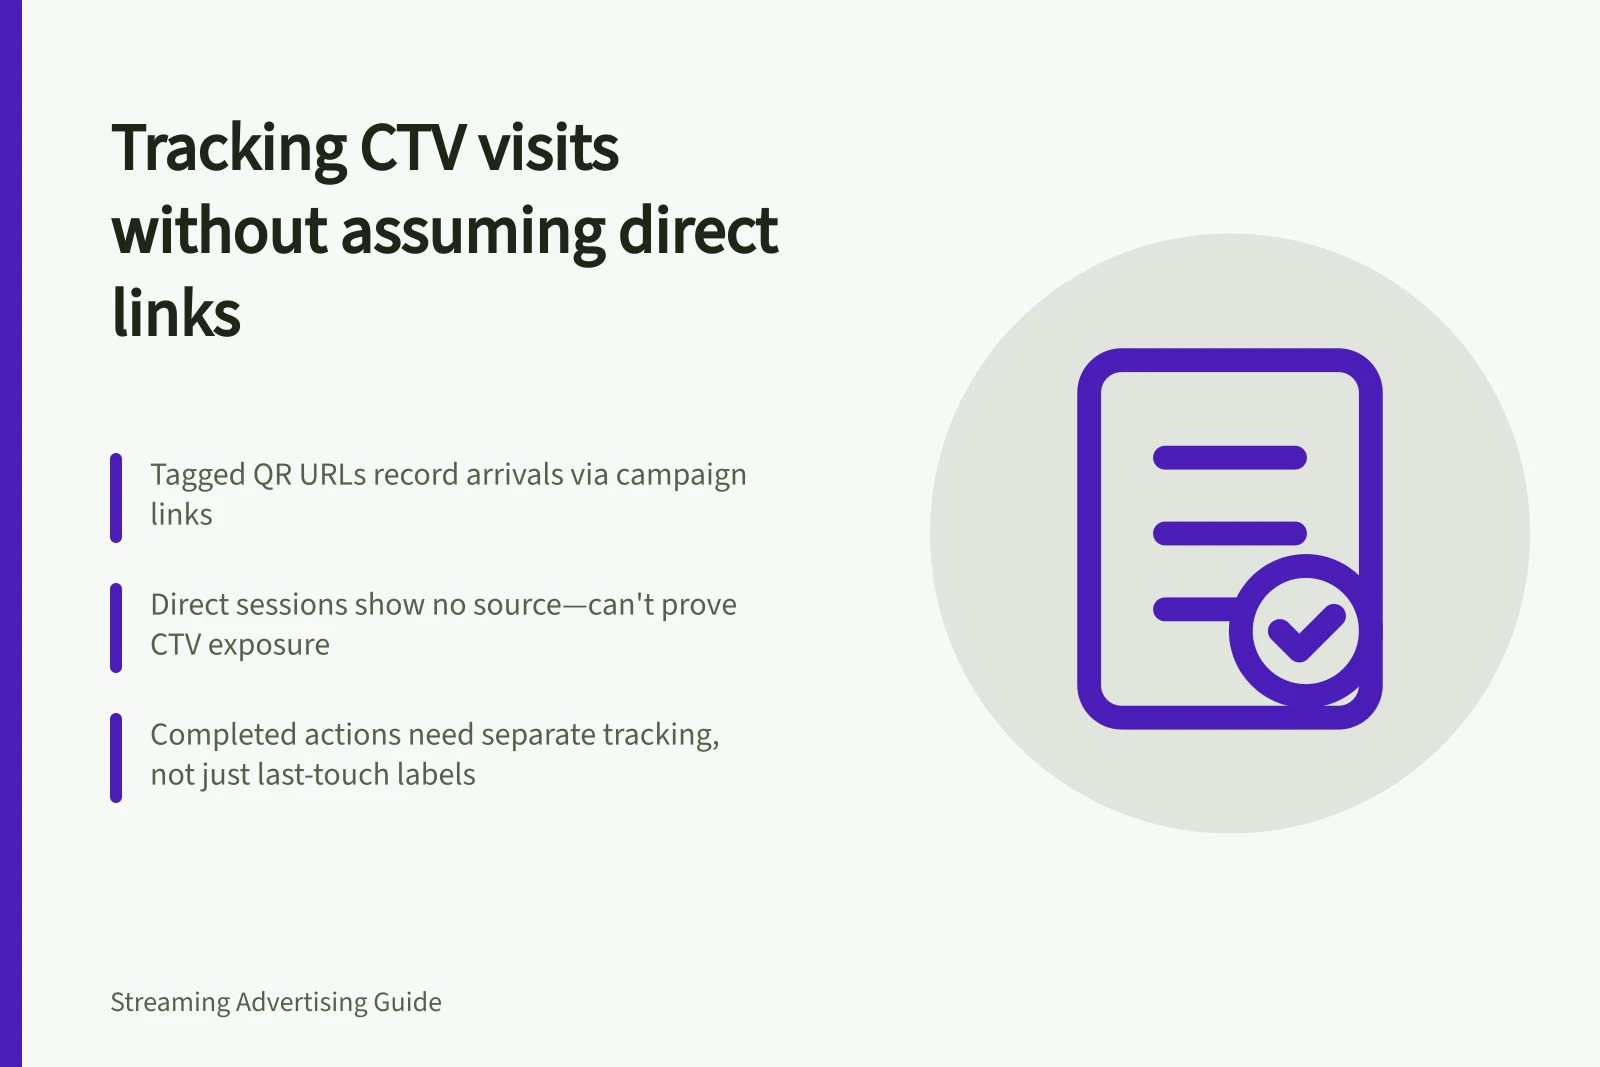
Measure CTV response by separating identifiable routes from visits with an unknown source. A tagged QR URL can show recorded arrivals through that URL if its parameters reach analytics. A direct session cannot establish that someone saw a CTV ad. Google Analytics documents a (direct) / (none) traffic category.
Make response routes observable
Use a consistent campaign-tagged URL for the QR route. Google Analytics provides URL builders to collect campaign data with custom URLs. If a short address redirects to the offer, record requests to it separately. Test final redirects so the intended page loads and tags survive.
Define the site action that matters, such as a completed enquiry or purchase, and check how it will be recorded. A platform scan, a page visit and a completed action are different events. Do not add their counts as though they represent different people.
| Report line | What it shows | What it cannot prove |
|---|---|---|
| Tagged QR URL visits | Recorded arrivals through that URL | Ad exposure or incremental action; the URL can be shared |
| Dedicated-address requests | Use of the address | Who saw the ad or why they used it |
| Direct sessions | Visits without a clear recorded source | CTV exposure |
| Completed site actions | Actions recorded on the site | That CTV caused them |
What Each Traffic Source Shows vs. What It Cannot Prove
- Tagged QR URL visits
- Recorded arrivals through that URL
- Dedicated-address requests
- Use of the address
- Direct sessions
- Visits without a clear recorded source
- Completed site actions
- Actions recorded on the site
Interpret changes with context
Choose a comparison period and keep site metrics and date boundaries consistent. Note campaign dates alongside other activity that could affect visits, such as search, social, email, promotions or site changes. A rise in direct sessions during the campaign can prompt investigation; by itself it cannot assign the rise to CTV.
Inspect the promoted landing page as well as site-wide totals. A rise on that page may fit the response story, but remains a correlation if the offer appears elsewhere. A last-touch analytics label is also not a causal estimate.
Key Metrics for Measuring CTV Response in Australia
- Campaign period
- Align with known marketing activity (e.g., search, social, email)
- Last-touch attribution
- Not causal; only indicates last interaction before conversion
- Google Analytics tracking
- Requires tagged URLs to observe response routes
Report only what was observed
Report tagged-route visits and their recorded site actions, then show short-address use and direct traffic as separate context. State the reporting window, tag scheme and any known gaps. If the QR treatment was not displayed on every TV impression, the tagged route covers only use of the URL where viewers could obtain it; shared use may also appear.
An incremental business-impact claim requires a suitable comparison or experiment. This visit report has a narrower job: show what each route recorded without turning unknown-source visits into a CTV conversion total.
Best Practices for Reporting CTV Response Without Overclaiming
- Use a consistent campaign-tagged URL for QR codesEnsure parameters survive redirects and reach analytics
- Define the key site action (e.g., purchase, enquiry)Do not sum page views, scans and actions as unique users
- Report observed data onlySeparate tagged QR visits from direct traffic and dedicated-address use
- Disclose reporting limitationsState window, tag scheme, and potential gaps (e.g., shared QR links)
- Avoid claiming causality from direct sessionsDo not attribute direct traffic to CTV without an experiment