Incrementality
Part of CTV attribution and incrementality
Separating household correlation from causal sales impact
See what household CTV-to-sales matching can show, why exposed buyers may differ and when a control is needed for a causal claim.
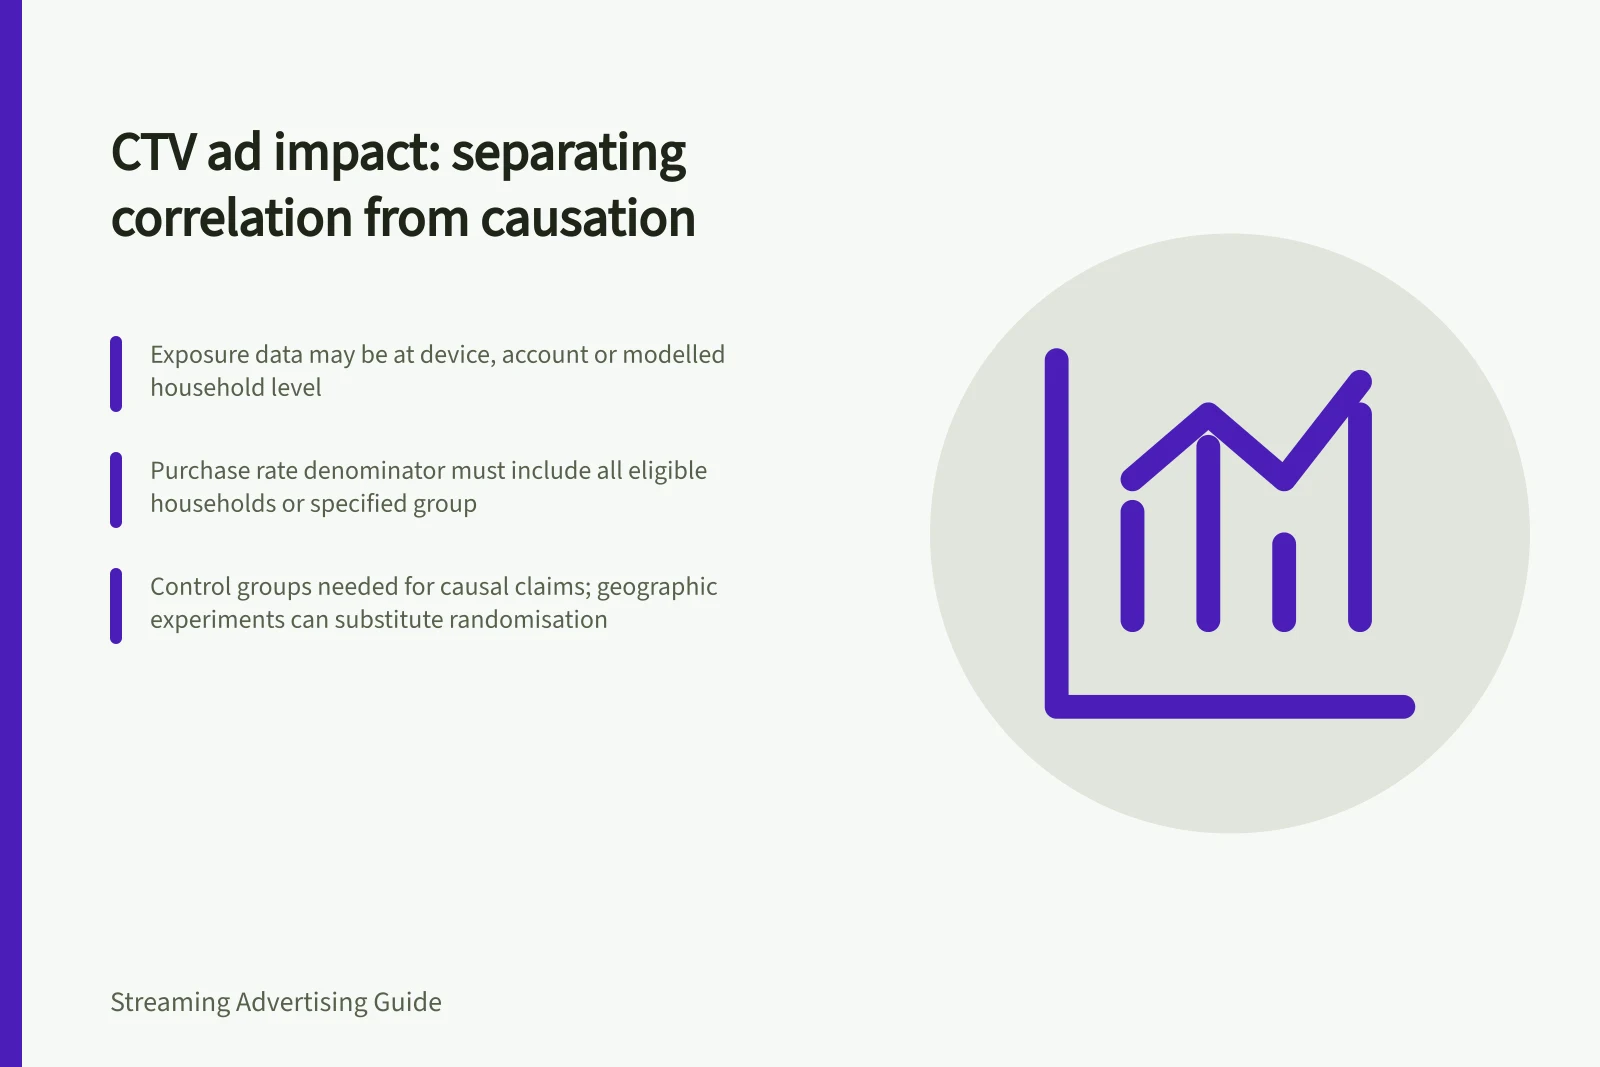
When households associated with CTV exposure buy more than other households, the report shows an association. It does not yet show that the ad caused the difference. Exposed households may already have been more likely to buy, and a household match cannot establish which resident watched or purchased.
Identify the records and the denominator
Find out whether exposure was recorded for a TV device, account or modelled household. Ask whether sales came from an online account, loyalty record, retailer dataset or another source. Identify the key that joined the records and whether the resulting link was at person or household level. Keep unmatched impressions and sales visible.
For a reported purchase rate, identify the denominator. Does it include every household with an eligible impression, only households the partner could match, or only households with a known purchasing record? Those groups can produce different rates. A result drawn from selected publishers or customers should be described as a result for that measured population.
Pros and Cons of Household-Level Matching for CTV-to-Sales Analysis
- ProsEnables measurement at household level; useful for targeting and attribution
- ConsCannot confirm which resident watched or purchased; may introduce bias if unmatched records excluded
Check why the groups might differ
A recent shopper may be more likely both to qualify for a targeted ad and to buy again. Demand, promotions, other media and stock can also differ between the groups. These are possible sources of bias to investigate, not findings about a campaign that has not been analysed.
Compare purchasing history and ad eligibility before interpreting an exposed-versus-unexposed table. Did the comparison households have a genuine opportunity to receive the ad, or were some outside the publisher's coverage? Were exposure and outcomes observed through the same data sources in both groups? A later sales gap cannot repair a fundamentally different comparison population.
| Number reported | Supported reading | Question left open |
|---|---|---|
| Purchases matched after CTV exposure | Purchases associated under the stated match and timing rules | How many would have occurred anyway? |
| Higher purchase rate among exposed households | A difference between measured groups | Were the groups comparable before exposure? |
| Effect estimate from a planned control | An estimate for the tested population and intervention | Would it apply to the next campaign? |
Exposed vs Unexposed Households: Key Differences to Investigate
- Purchase Rate
- Higher in exposed households
- Pre-exposure Purchasing History
- May be stronger for exposed group
- Ad Eligibility
- Not all comparison households had opportunity to receive ad
- Data Source Consistency
- Must match across exposure and outcome groups
Use a control for a causal spending claim
Where feasible, assign eligible units to treatment and control before delivery. Define the outcome and assignment rule in advance, then analyse units according to the planned design, including non-buyers. If assignment cannot be randomised, the causal interpretation depends on a credible comparison and its stated assumptions.
A geographic experiment may be more practical when reliable household assignment is unavailable. It estimates a market-level effect; it does not identify an individual buyer. Report an effect estimate with uncertainty and the population it covers. If a credible control is unavailable, keep the association report, label it accurately and use it to inform a later test.